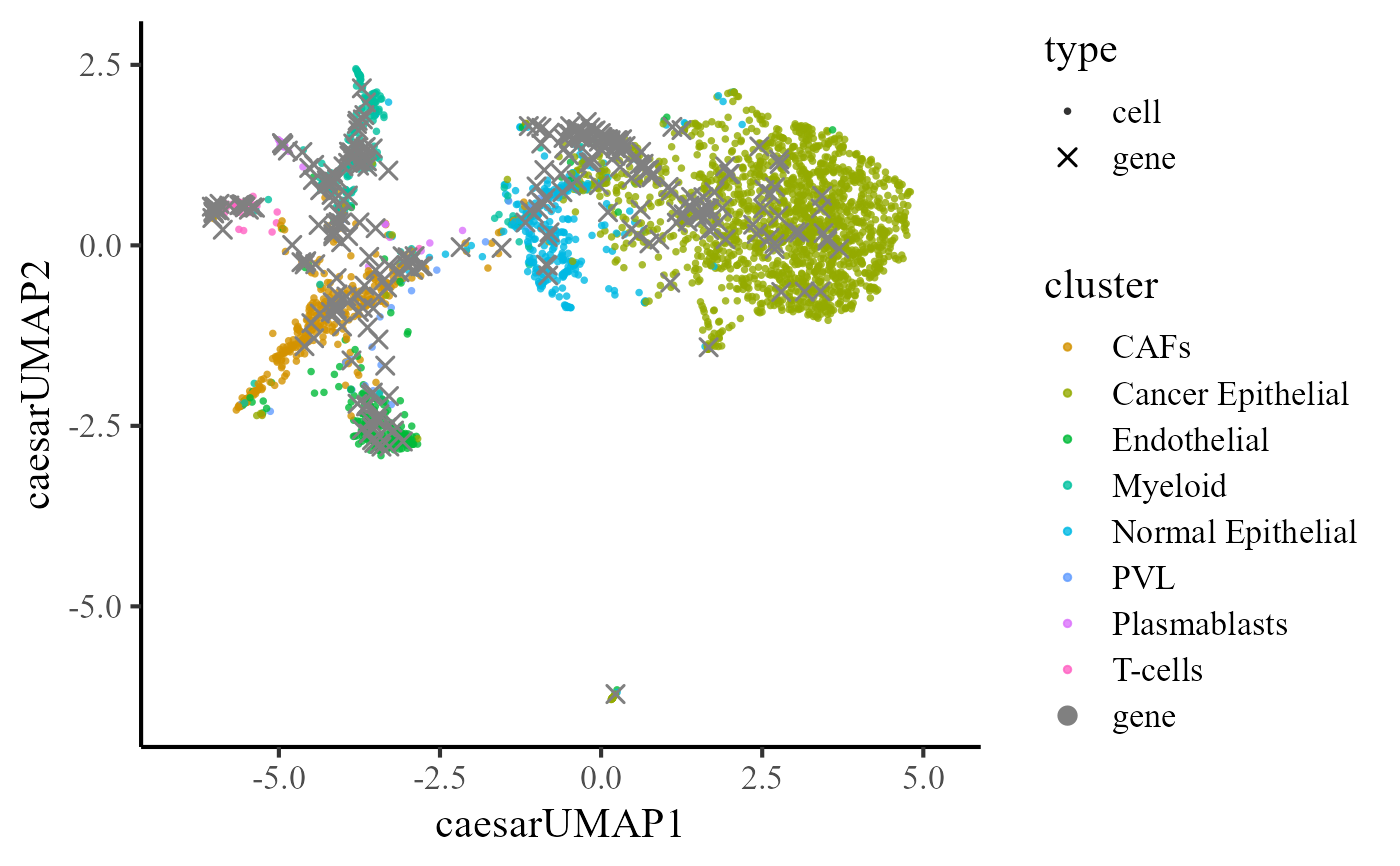
This function generates a UMAP plot for co-embedding genes and cells in a Seurat object. It allows for customization of point colors, shapes, and text labels, and can display both gene and cell embeddings in the same plot.
Arguments
- seu
A Seurat object containing the co-embedding data.
- reduction
A character string specifying the name of the dimensional reduction to use for the UMAP plot. Default is "caesarUMAP".
- gene_txtdata
A data frame containing gene names and labels to display as text on the plot. If
NULL, no text labels are shown. Default isNULL.- ident
A character string specifying the column name in the Seurat object's metadata that contains cell type or cluster labels. If
NULL, the default identities (Idents(seu)) are used. Default isNULL.- xy_name
A character string specifying the prefix for the UMAP axes. Default is the value of
reduction.- dims
A numeric vector of length 2 specifying which dimensions to plot. Default is
c(1, 2).- cols
A named vector of colors for clusters. If
NULL, default colors are generated. Default isNULL.- shape_cg
A numeric vector of length 2 specifying the shapes for cells and genes. Default is
c(1, 5).- pt_size
Numeric, specifying the size of the points for cells and genes. Default is 1.
- pt_text_size
Numeric, specifying the size of the text labels for genes. Default is 5.
- base_size
Numeric, specifying the base font size for the plot. Default is 16.
- base_family
Character string specifying the font family for the plot. Default is "serif".
- legend.point.size
Numeric, specifying the size of the points in the legend. Default is 5.
- legend.key.size
Numeric, specifying the size of the legend keys. Default is 1.5.
- alpha
Numeric, specifying the transparency level for cell points. Default is 0.8.
Value
A ggplot object representing the UMAP plot.
Details
The function creates a UMAP plot that shows both gene and cell embeddings. Gene embeddings can be optionally labeled with text, and the plot can be customized with different colors, shapes, and sizes.
See also
CoUMAP for obtain co-embedding UMAP.